OpenCV 车道检测项目入门项目DEMO
笔记哥 /
04-29 /
41点赞 /
0评论 /
178阅读
# 从车道检测项目入门open cv
> 前提声明:非常感谢b站up主 **嘉然今天吃带变**,感谢其视频的帮助。同时希望各位大佬积积极提出宝贵的意见。😊😊😊(❁´◡`❁)(●'◡'●)╰(*°▽°*)╯
> github地址:https://github.com/lizhongzheng13/openCV_Lane_Detection/tree/main
> 视频地址:[从车道检测项目入门open cv](https://www.bilibili.com/video/BV1qk4y1r7jw/?spm_id_from=333.1391.0.0&p=10&vd_source=3c58a56884ef40ab5aa99f8a00685d85)
### 基础知识
#### cv2.imread & cv2.imshow & cv2.imwrite
```python
import cv2 as cv
img = cv.imread("img.png", cv.IMREAD_GRAYSCALE) #将图片转为灰度图
```
>
>
> 但是当前会存在一些问题,图片会闪一下,看不清楚,所以我们可以加上阻塞 `cv2.waitKey()`函数
>
```python
#完整版
import cv2 as cv
img = cv.imread("img.png", cv.IMREAD_GRAYSCALE)
print(type(img))
print(img.shape)
cv.imshow('image', img)
k = cv.waitKey(0) # 阻塞 #k相当于检测你的输入的ascii值
print(k)
# while True:
# if cv.waitKey(0) == ord('q'):
# cv.destroyAllWindows()
# else:
# img = cv.imread("img.png", cv.IMREAD_GRAYSCALE)
cv.imwrite("img_gray.png", img)#生成img图片,保存到当前目录中~
```
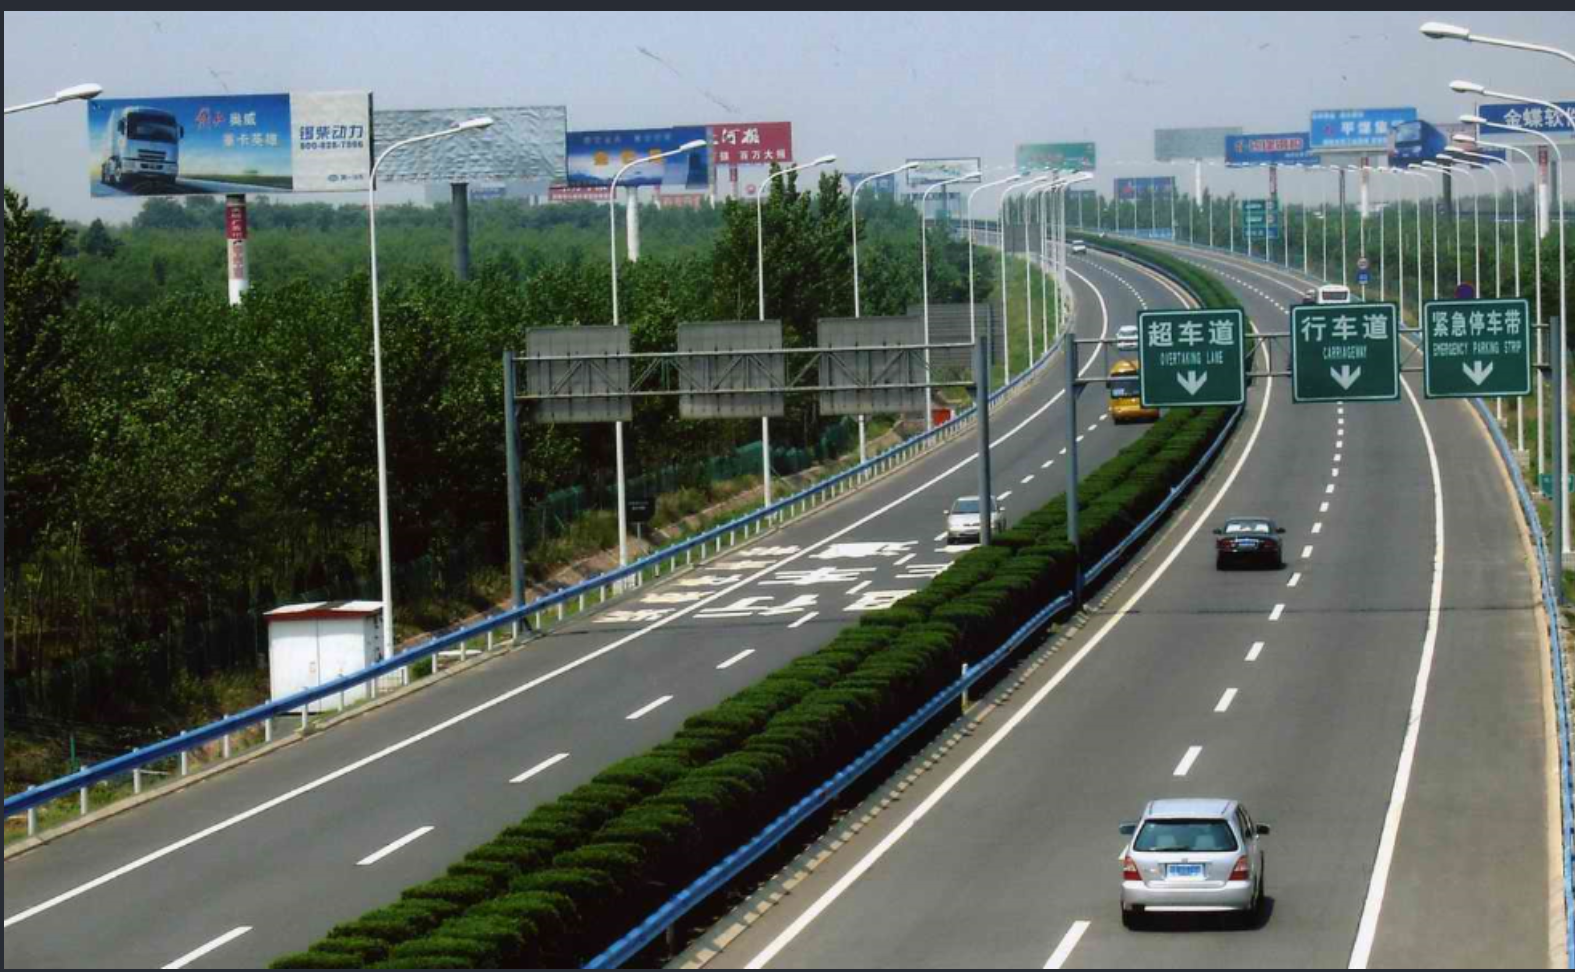
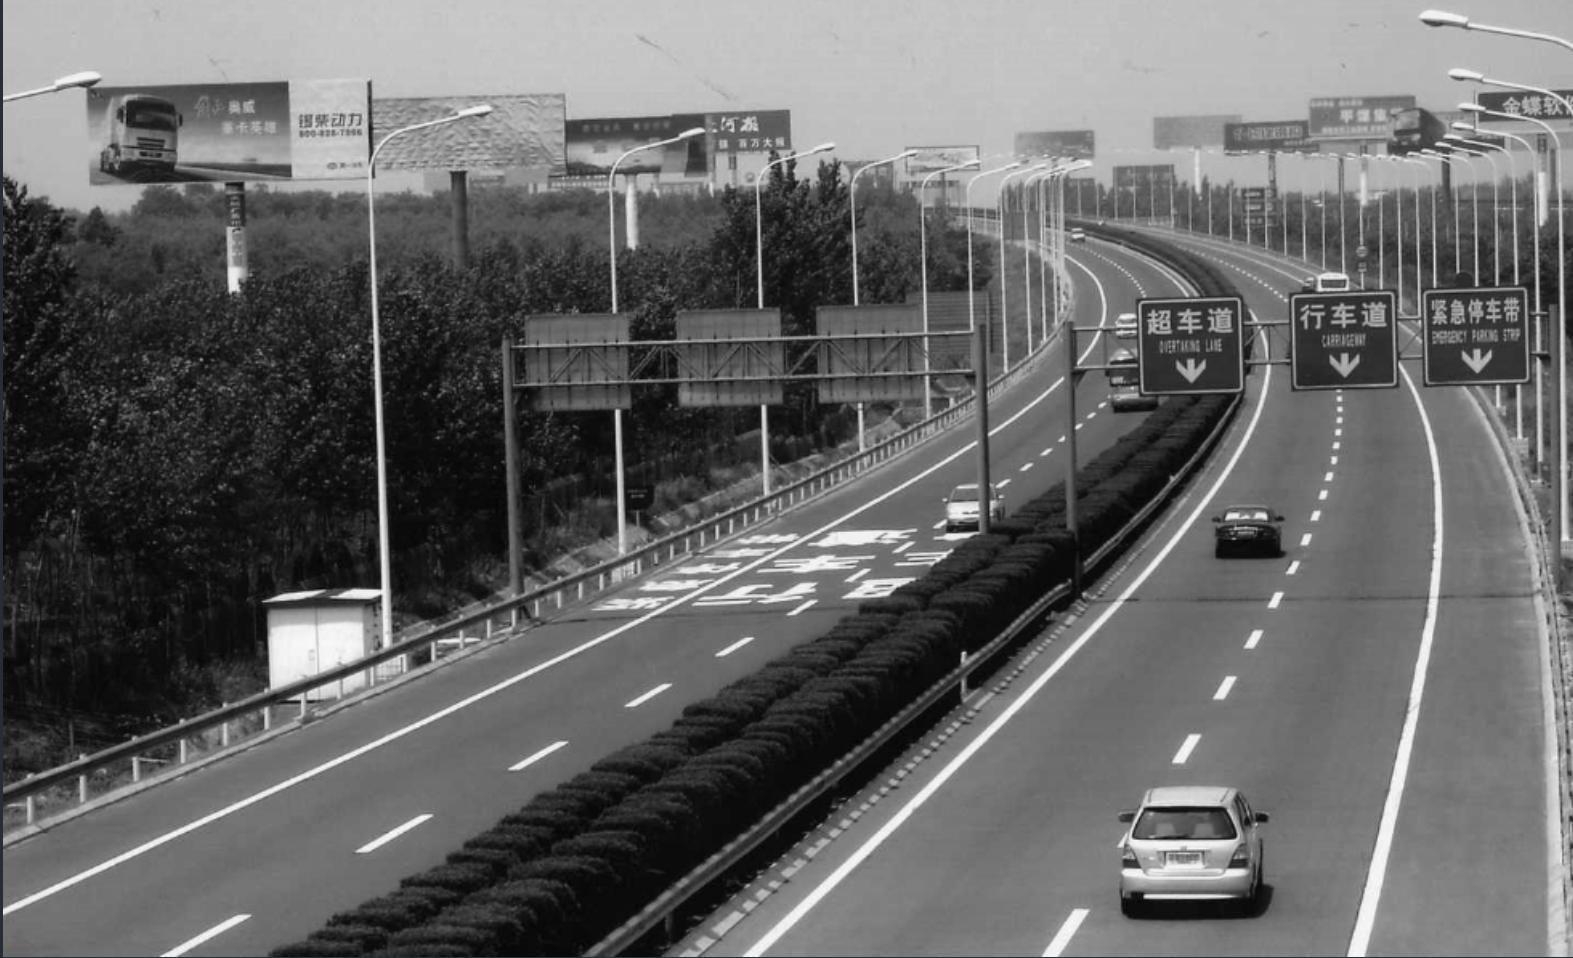
效果展示
>
>
> 原始图像:
>
> 
>
> 灰度图:
>
> 
* * *
### Canny边缘检测
>
>
> 通过求取图像上每一个像素点周边图像像素变化的梯度,来确定这个点是否是边缘。
>
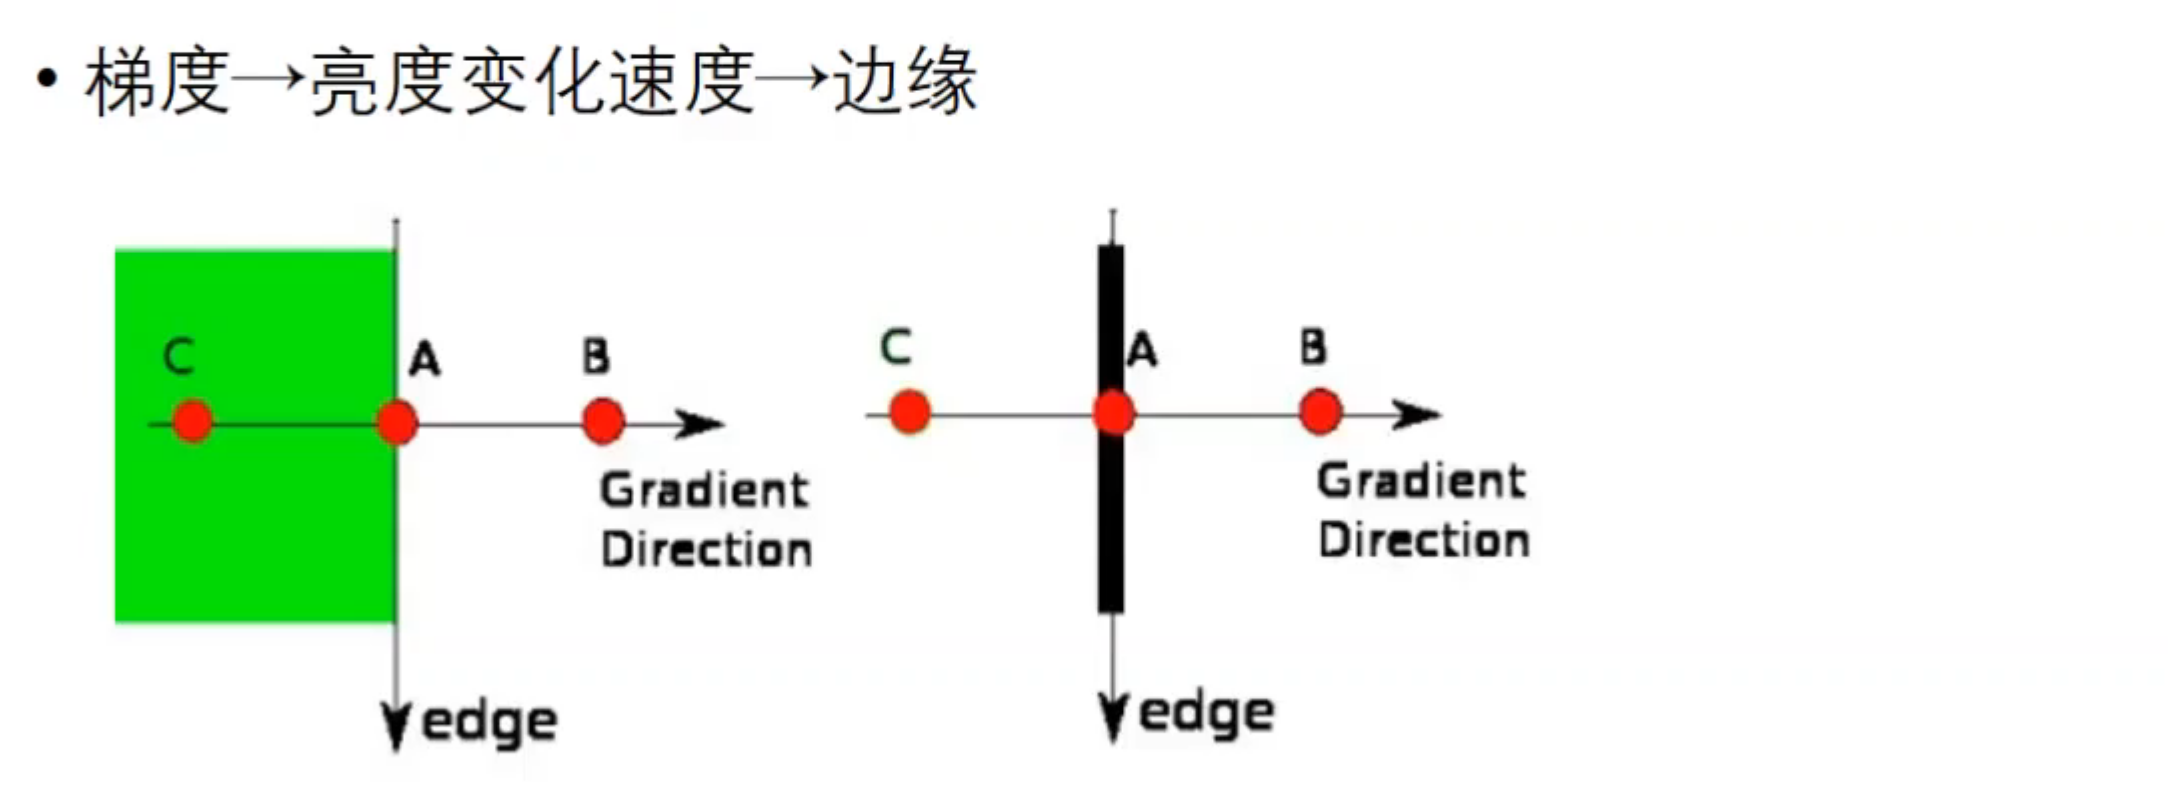
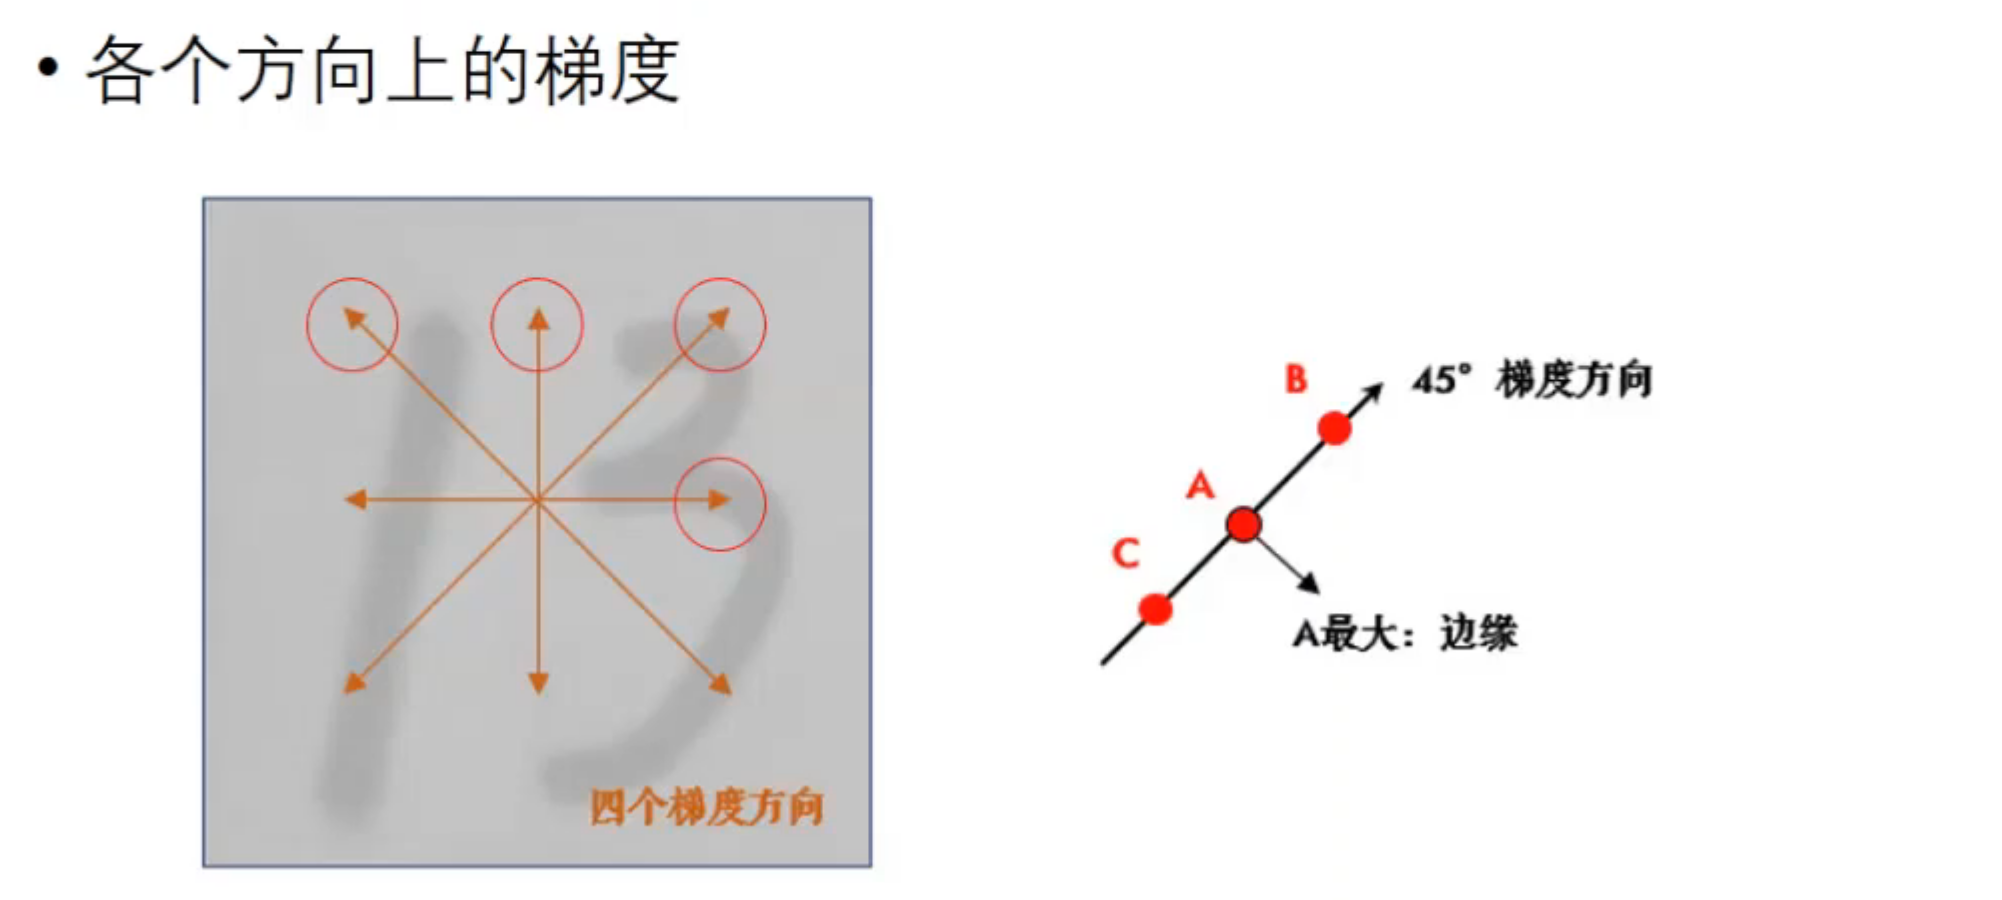
梯度的方向一般总是与边界垂直,梯度的方向被归为四类:垂直、水平和两个对角线(即,0度、45度、90度和135度四个方向)。
我们现在的想法是设置一个阈值,当梯度大于阈值时,我们可以认为该点是边缘。但是随之而来的是,图片会产生一些毛边或者光线,角度等问题,导致可能会误判。
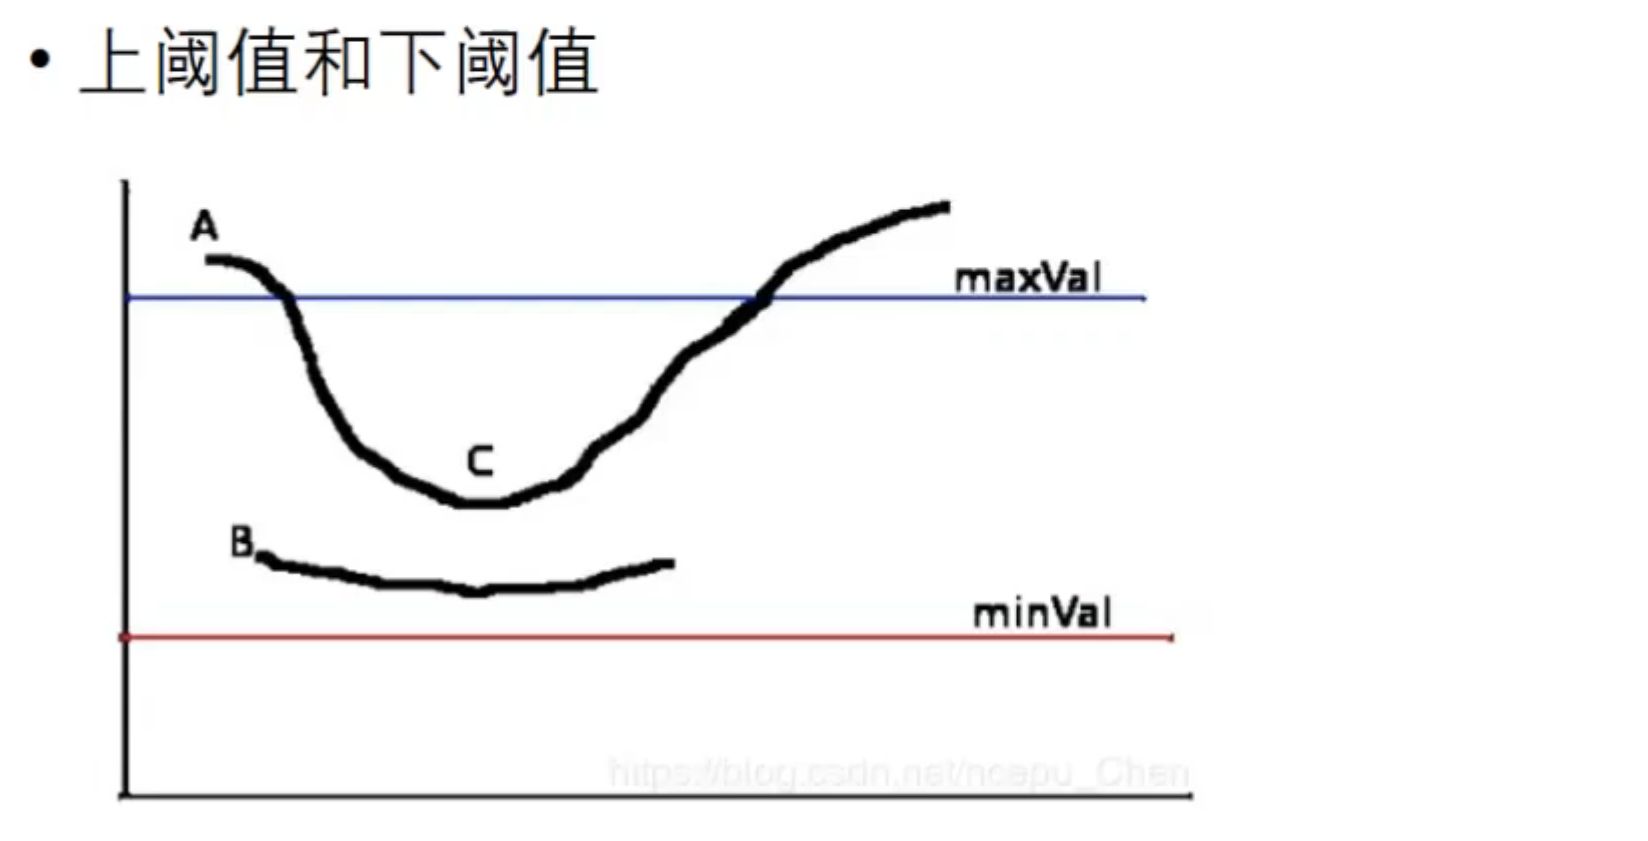
为了解决这个问题,我们采用双阈值的方法,一个上阈值,一个下阈值。
>
>
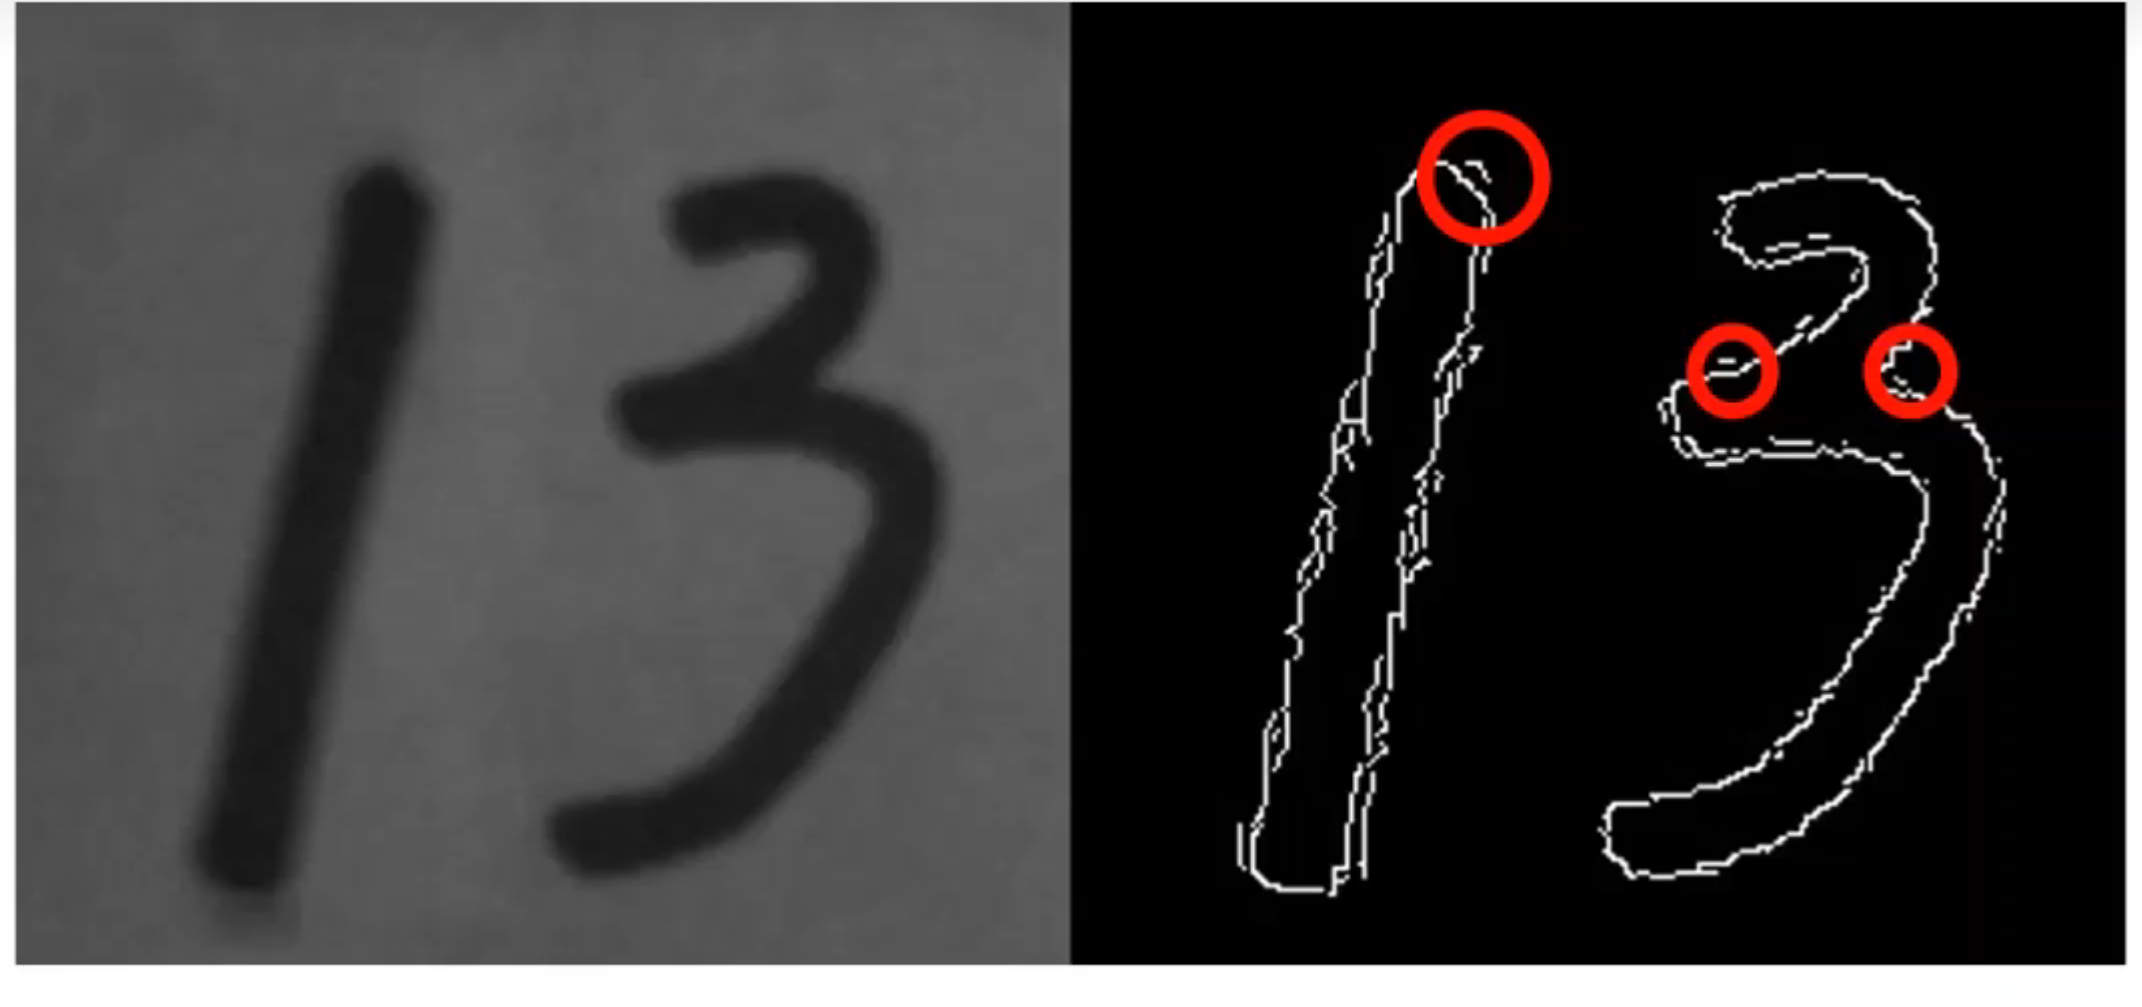
> 我们认为高于上阈值的点为强边缘,在上阈值和下阈值之间的我们认为是弱边缘。
>
>
> 我们认为只有弱边缘与强边缘相连的话,才是边缘。B不认为是边缘,可能是噪声;C与A强边缘相连,我们认为C是边缘。
>
```py
import cv2
img = cv2.imread("img.png", cv2.IMREAD_GRAYSCALE)
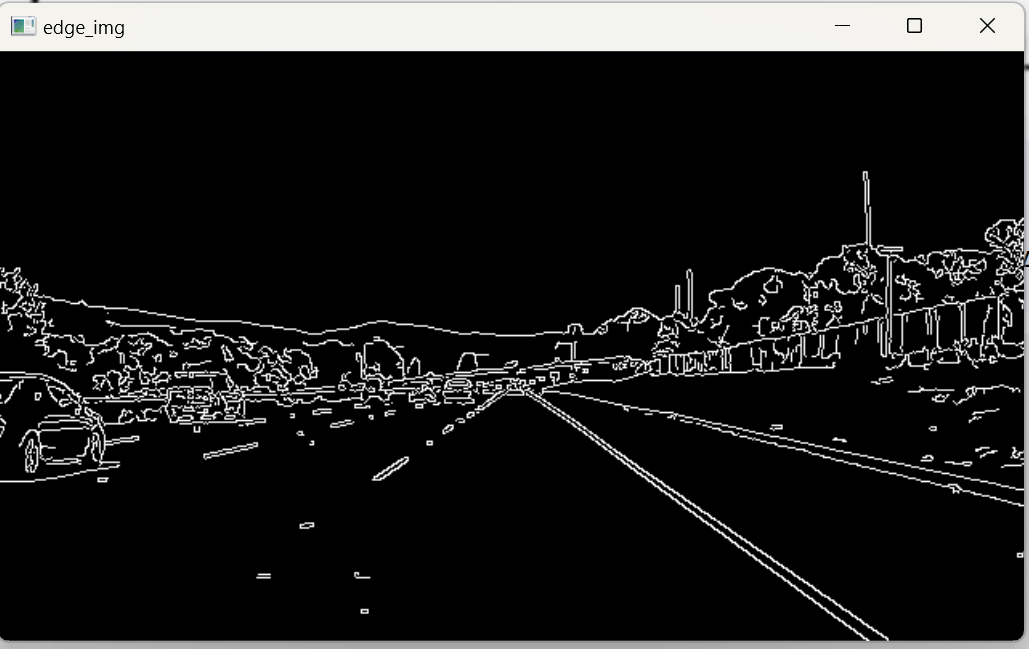
edge_img = cv2.Canny(img, 190, 350) # 下边缘和上边缘的阈值设定 #需要自行更改
cv2.imshow("edge", edge_img)
cv2.waitKey(0)
```
>
>
> 当上边缘和下边缘都升高时,边缘显示会越来越少。
>
* * *
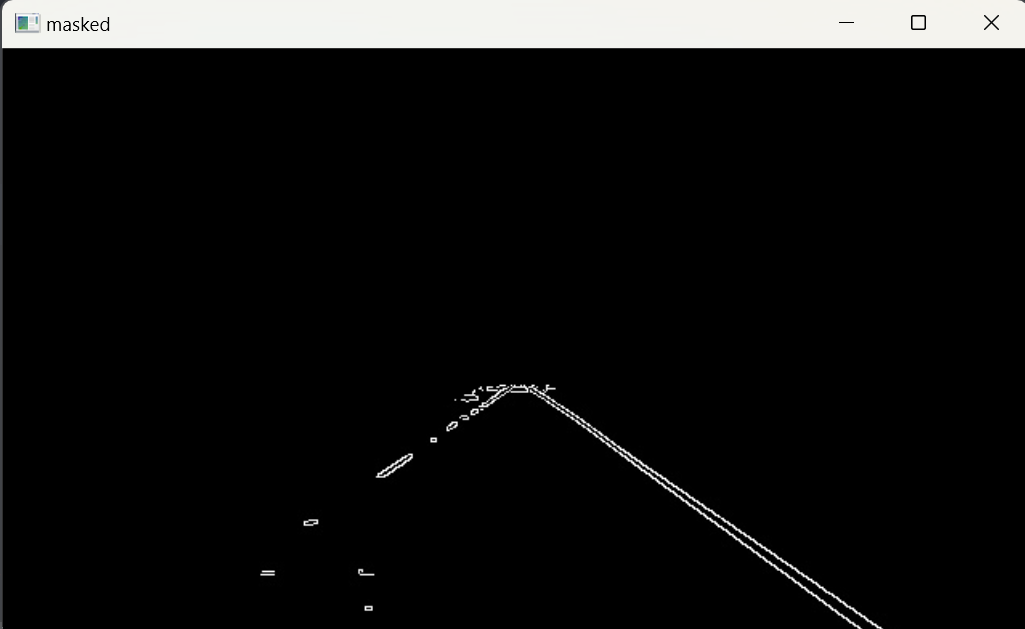
### ROI mask
简单来讲就是类似于抠图,就是剔除无关信息的边缘。
roi : region of interest 感兴趣的区域
数组切片
布尔运算(与运算)
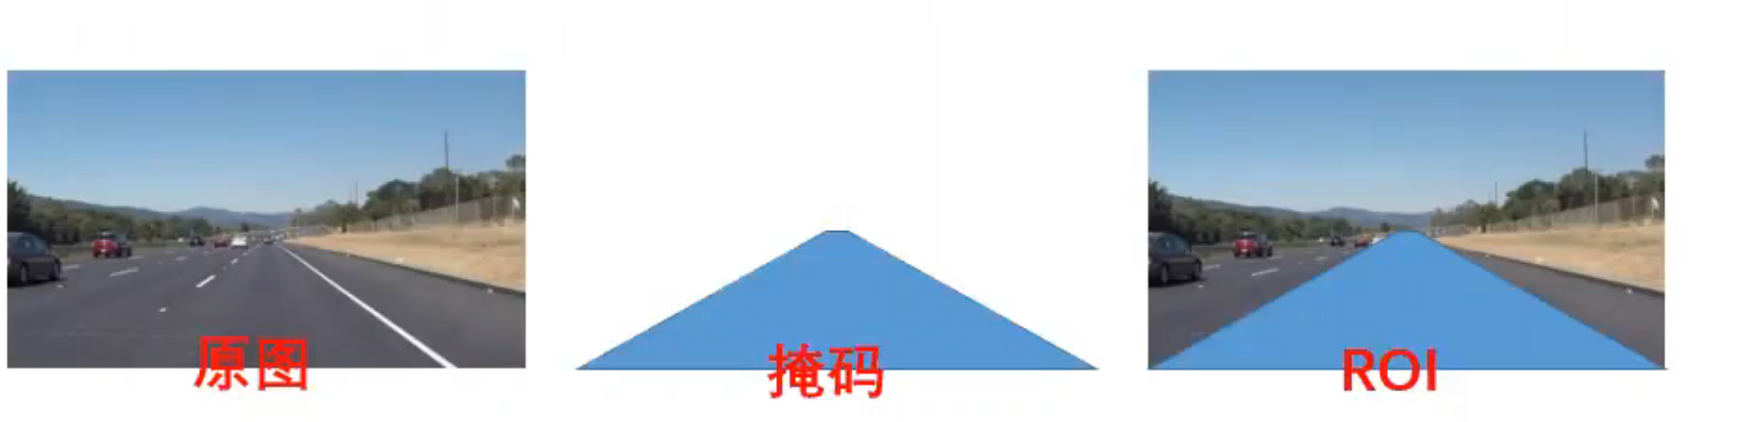
- `cv2.fillPoly` 是 OpenCV 中的一个函数,用于在图像中填充多边形区域。它常用于绘制、遮罩或标记图像中的特定区域。通过指定多边形的顶点,`cv2.fillPoly` 可以将这些区域填充为指定的颜色。
- `cv2.bitwise_and` 是 OpenCV 中的一个函数,用于对两个图像或数组进行按位与(bitwise AND)操作。按位与操作是逐像素进行的,只有当两个图像的对应像素都为非零值时,结果图像的该像素才为非零值。
- **图像遮罩**:
- 使用掩码提取图像的特定区域。例如,将一个形状(如矩形、圆形或多边形)作为掩码,只保留掩码内的图像内容。
- **图像合成**:
- 将两个图像的特定部分组合在一起。
- **图像处理**:
- 在图像处理中,按位与操作常用于对图像进行区域选择或区域遮挡。
图像以矩阵np.array形式存储在内存中
np.zeros\_like : `np.zeros_like` 是 NumPy 库中的一个函数,用于创建一个与给定数组形状和数据类型相同的数组,但所有元素都初始化为零。
```py
# @Author : LiZhongzheng
# 开发时间 :2025-04-28 17:30
import cv2
import numpy as np
edge_img = cv2.imread("edge_img.png", cv2.IMREAD_GRAYSCALE)
mask = np.zeros_like(edge_img) # 获取一个与edge_img大小相同的数组
mask = cv2.fillPoly(mask, np.array([[[0, 569], [661, 195], [914, 248], [979, 592]]]),
color=255) # array中的存放的是想要识别区域的四个顶点 #顺序为左下、左上、右上、右下
masked_edge_img = cv2.bitwise_and(edge_img, mask)
# cv2.imshow('mask', mask)
# cv2.waitKey(0)
cv2.imshow("edged", masked_edge_img)
cv2.waitKey(0)
```
* * *
### 霍夫变换
提取图片中的直线。
注意:霍夫变换是**针对灰度图**的。
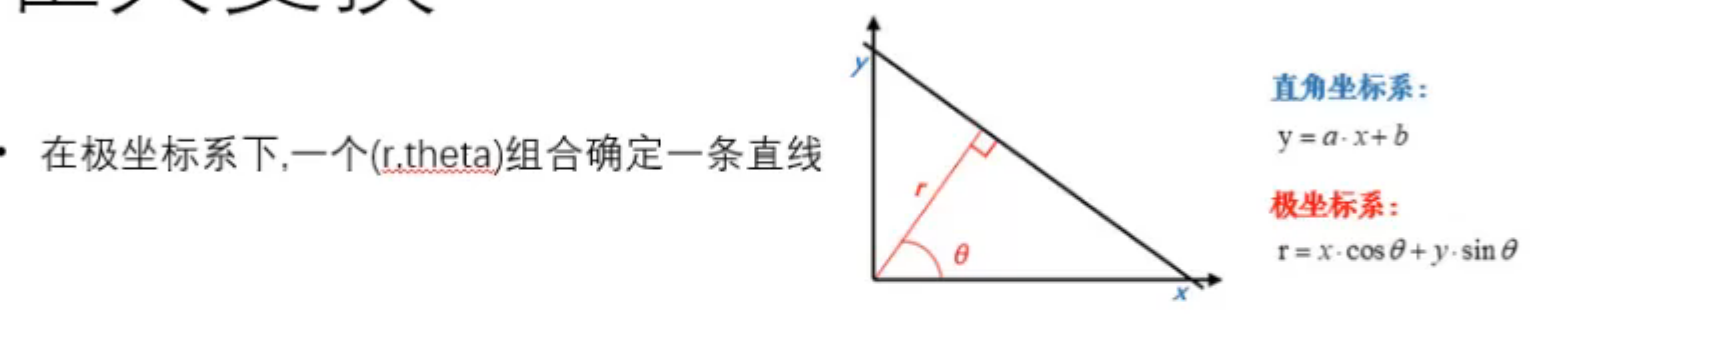
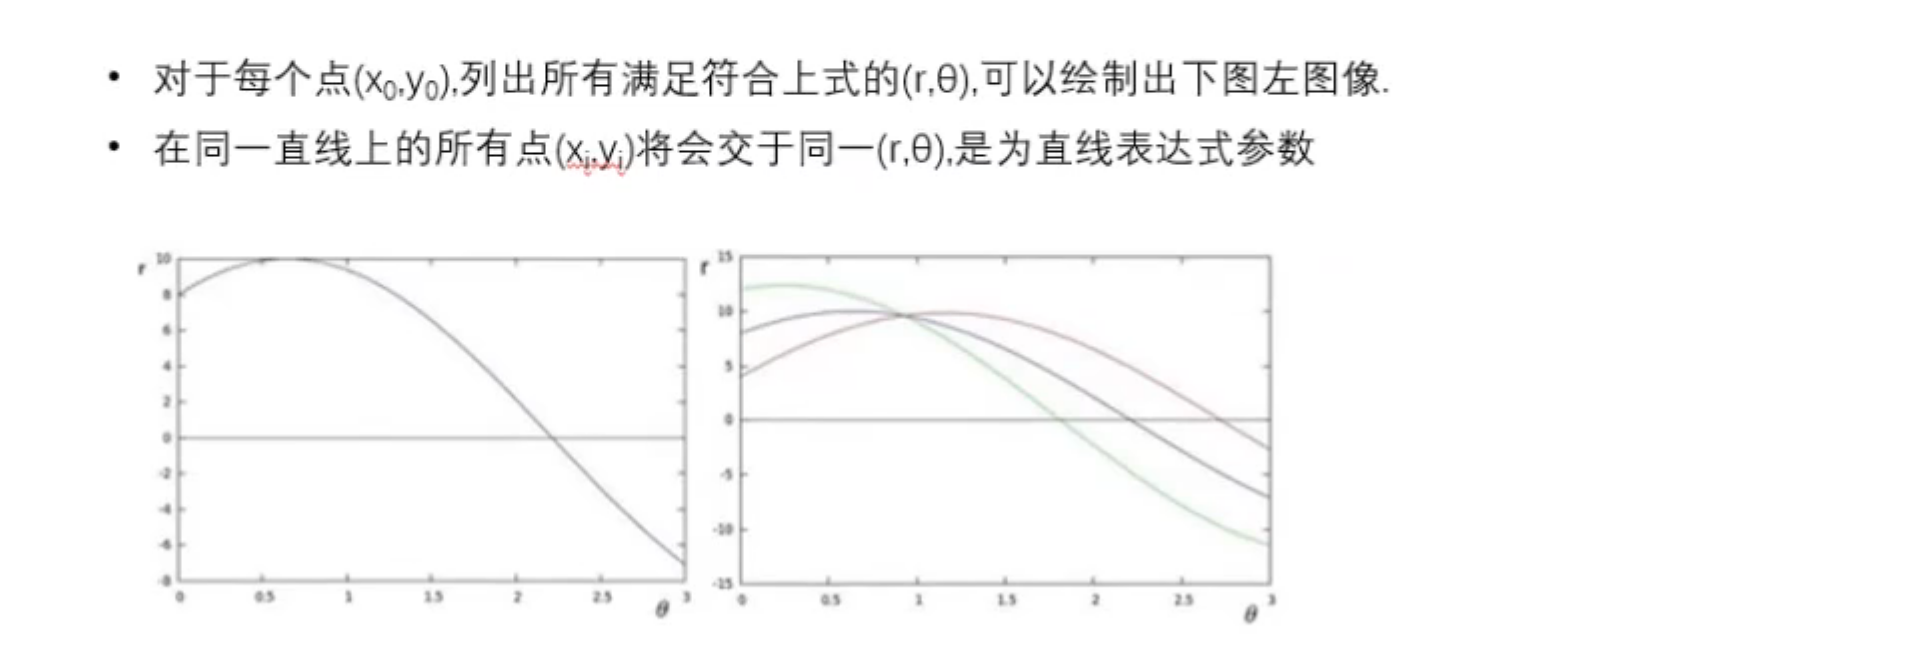
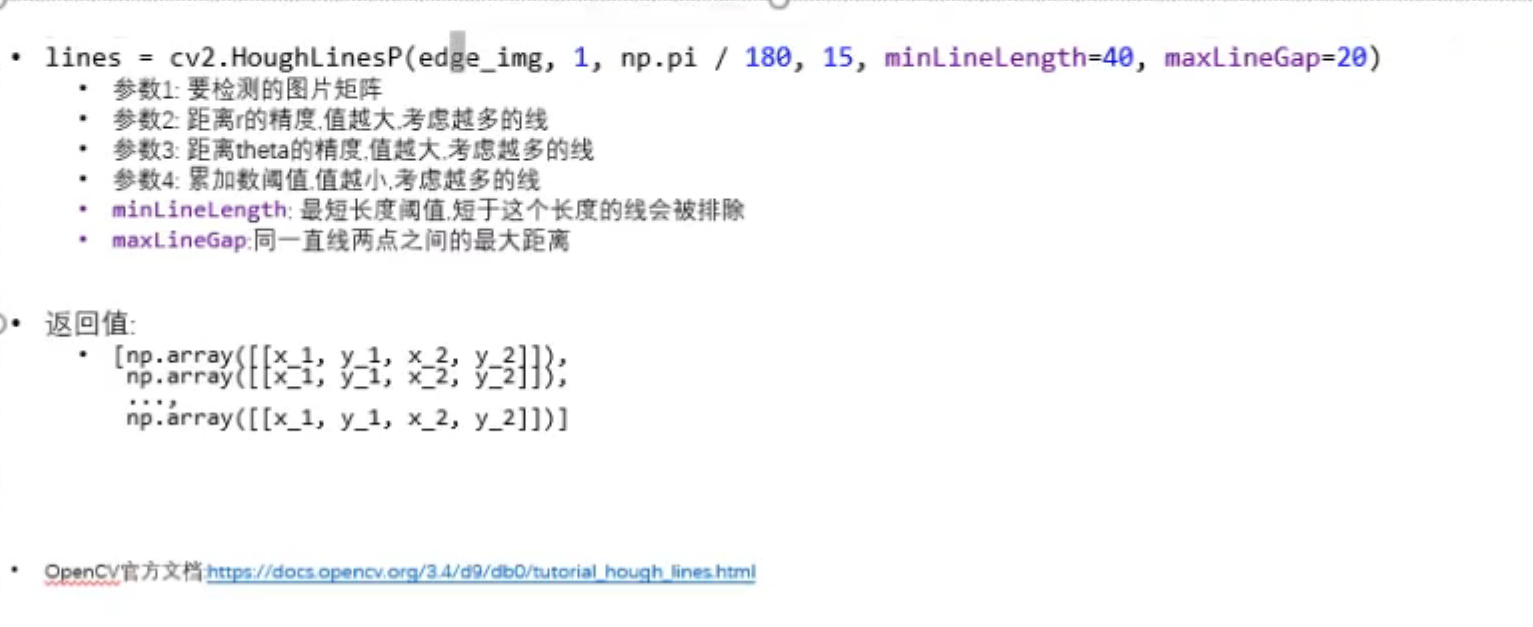
>
>
> min是最短线段的长度,max是两点之间的最大距离,超过这个距离就不认为是线段了。
>
- 首先经过 cv2.HoughLinesP()函数获取到所有的线条,然后计算线条的斜率,根据斜率的正负判断是左车道线还是右车道线。
- ```py
# @Author : LiZhongzheng
# 开发时间 :2025-04-29 8:54
import cv2
import numpy as np
def calculate_slope(line):
"""
计算线段line的斜率
:param line: np.array([[x_1, y_1, x_2, y_2]])
:return:
"""
x_1, y_1, x_2, y_2 = line[0]
return (y_2 - y_1) / (x_2 - x_1)
edge_img = cv2.imread('masked_edge_img.jpg', cv2.IMREAD_GRAYSCALE)
# 获取所有线段
lines = cv2.HoughLinesP(edge_img, 1, np.pi / 180, 15, minLineLength=40,
maxLineGap=20)
# 按照斜率分成车道线
left_lines = [line for line in lines if calculate_slope(line) > 0]
right_lines = [line for line in lines if calculate_slope(line) < 0]
print("left_lines =", len(left_lines))
print("right_lines =", len(right_lines))
```
* * *
### 离群值过滤
剔除出因为误差而被识别出的直线。
**如何分解出噪点和车道线那?**
- 我们可以知道,车道线的斜率大致是相同的,进而可以分辨出噪点和车道线。
```python
# @Author : LiZhongzheng
# 开发时间 :2025-04-29 9:01
import cv2
import numpy as np
"""
剔除出因为误差而被识别出的直线。
如何分解出噪点和车道线那?
我们可以知道,车道线的斜率大致是相同的,进而可以分辨出噪点和车道线。
"""
def calculate_slope(line):
"""
计算线段line的斜率
:param line: np.array([[x_1, y_1, x_2, y_2]])
:return:
"""
x_1, y_1, x_2, y_2 = line[0]
return (y_2 - y_1) / (x_2 - x_1)
edge_img = cv2.imread('masked_edge_img.jpg', cv2.IMREAD_GRAYSCALE)
# 获取所有线段
lines = cv2.HoughLinesP(edge_img, 1, np.pi / 180, 15, minLineLength=40, maxLineGap=20)
# 按照斜率分成车道线
left_lines = [line for line in lines if calculate_slope(line) > 0]
right_lines = [line for line in lines if calculate_slope(line) < 0]
def reject_abnormal_lines(lines, threshold):
"""
剔除斜率不一致的线段
:param lines: 线段集合, [np.array([[x_1, y_1, x_2, y_2]]),np.array([[x_1, y_1, x_2, y_2]]),...,np.array([[x_1, y_1, x_2, y_2]])]
"""
slopes = [calculate_slope(line) for line in lines]
while len(lines) > 0:
mean = np.mean(slopes) # 使用 NumPy 的 np.mean 函数计算当前所有斜率的平均值
diff = [abs(s - mean) for s in slopes] # 遍历 slopes 列表,计算每个斜率与平均斜率的绝对差值,并将结果存储在 diff 列表中
idx = np.argmax(diff) # 使用 NumPy 的 np.argmax 函数找到 diff 列表中最大值的索引,即斜率差异最大的线段。
if diff[idx] > threshold: # 如果最大差异大于阈值 threshold,则认为该线段是异常的,将其从 slopes 和 lines 列表中移除。
slopes.pop(idx)
lines.pop(idx)
else: # 如果最大差异小于或等于阈值,则认为所有线段的斜率已经足够一致,退出循环。
break
return lines # 如果最大差异小于或等于阈值,则认为所有线段的斜率已经足够一致,退出循环。
print('before filter:')
print('left lines number=')
print(len(left_lines))
print('right lines number=')
print(len(right_lines))
reject_abnormal_lines(left_lines, threshold=0.2)
reject_abnormal_lines(right_lines, threshold=0.2)
print('after filter:')
print('left lines number=')
print(len(left_lines))
print('right lines number=')
print(len(right_lines))
```
* * *
### 最小二乘拟合
将lines的线段拟合成一条直线。
np.ravel 将高维数组拉成一维
np.polyfit 多项式拟合
np.polyval 多项式求值
- 经过上述的步骤,进而我们可以求出车道线的数量等信息,同时又剔除了噪点。然后我们就可以将在同一个区域的线段拟合一条直线
- ```python
# @Author : LiZhongzheng
# 开发时间 :2025-04-29 15:58
import cv2
import numpy as np
def calculate_slope(line):
"""
计算线段line的斜率
:param line: np.array([[x_1, y_1, x_2, y_2]])
:return:
"""
x_1, y_1, x_2, y_2 = line[0]
return (y_2 - y_1) / (x_2 - x_1)
edge_img = cv2.imread("masked_edge_img.jpg", cv2.IMREAD_GRAYSCALE)
# 获取所有线段
lines = cv2.HoughLinesP(edge_img, 1, np.pi / 180, 15, minLineLength=40, maxLineGap=20)
# 按照斜率分成车道线
left_lines = [line for line in lines if calculate_slope(line) > 0]
right_lines = [line for line in lines if calculate_slope(line) < 0]
def reject_abnormal_lines(lines, threshold):
"""
剔除斜率不一致的线段
:param lines: 线段集合, [np.array([[x_1, y_1, x_2, y_2]]),np.array([[x_1, y_1, x_2, y_2]]),...,np.array([[x_1, y_1, x_2, y_2]])]
"""
slopes = [calculate_slope(line) for line in lines]
while len(lines) > 0:
mean = np.mean(slopes)
diff = [abs(s - mean) for s in slopes]
idx = np.argmax(diff)
if (diff[idx] > threshold):
slopes.pop(idx)
lines.pop(idx)
else:
break
return lines
left_lines = reject_abnormal_lines(left_lines, threshold=0.2)
right_lines = reject_abnormal_lines(right_lines, threshold=0.2)
def least_squares_fit(lines):
"""
将lines中的线段拟合成一条线段
:param lines: 线段集合, [np.array([[x_1, y_1, x_2, y_2]]),np.array([[x_1, y_1, x_2, y_2]]),...,np.array([[x_1, y_1, x_2, y_2]])]
:return: 线段上的两点,np.array([[xmin, ymin], [xmax, ymax]])
"""
# 1. 取出所有坐标点
"""
在 OpenCV 中,线段通常用一个形状为 (1, 4) 的 NumPy 数组表示,其中包含线段的两个端点的坐标。
具体来说,数组的格式为 [x1, y1, x2, y2],分别表示起点 (x1, y1) 和终点 (x2, y2)。
"""
x_coords = np.ravel([[line[0][0], line[0][2]] for line in lines]) # np.ravel 将二维列表展平为一维数组
y_coords = np.ravel([[line[0][1], line[0][3]] for line in lines])
# 2. 进行直线拟合.得到多项式系数
poly = np.polyfit(x_coords, y_coords, deg=1)
# 3. 根据多项式系数,计算两个直线上的点,用于唯一确定这条直线
point_min = (np.min(x_coords), np.polyval(poly, np.min(x_coords)))
point_max = (np.max(x_coords), np.polyval(poly, np.max(x_coords)))
return np.array([point_min, point_max], dtype=np.int32)
print("left lane")
print(least_squares_fit(left_lines))
print("right lane")
print(least_squares_fit(right_lines))
```
* * *
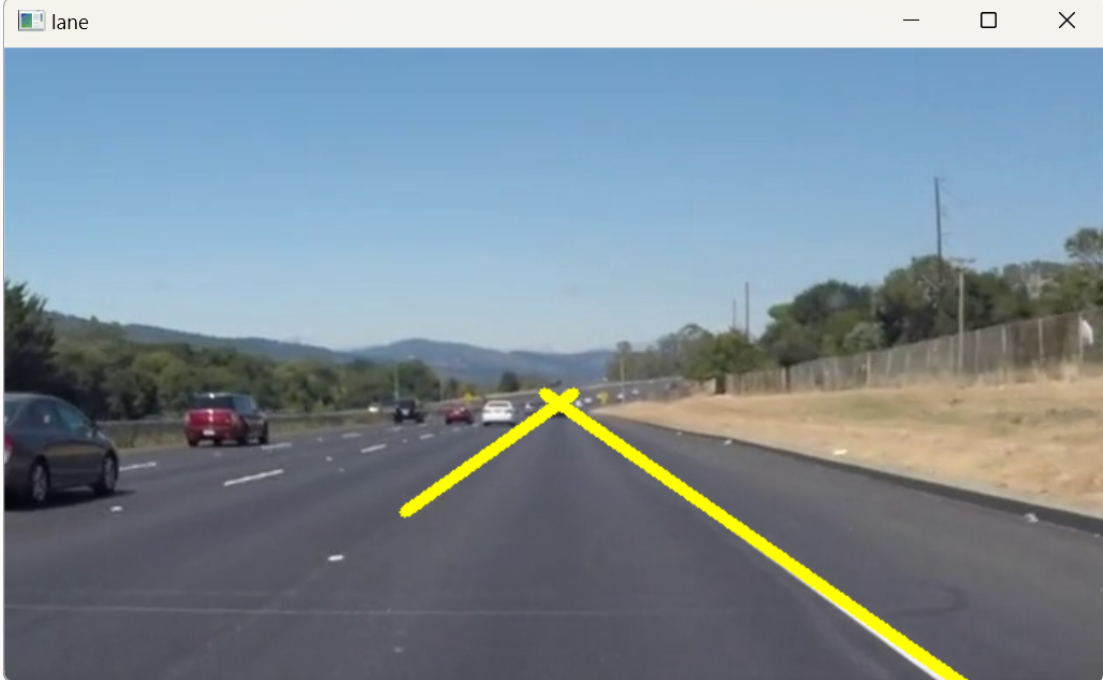
### 直线绘制
绘制车道线 cv2.line
```py
# @Author : LiZhongzheng
# 开发时间 :2025-04-29 16:23
import cv2
import numpy as np
def calculate_slope(line):
"""
计算线段line的斜率
:param line: np.array([[x_1, y_1, x_2, y_2]])
:return:
"""
x_1, y_1, x_2, y_2 = line[0]
return (y_2 - y_1) / (x_2 - x_1)
edge_img = cv2.imread('masked_edge_img.jpg', cv2.IMREAD_GRAYSCALE)
# 获取所有线段
lines = cv2.HoughLinesP(edge_img, 1, np.pi / 180, 15, minLineLength=40,
maxLineGap=20)
# 按照斜率分成车道线
left_lines = [line for line in lines if calculate_slope(line) > 0]
right_lines = [line for line in lines if calculate_slope(line) < 0]
def reject_abnormal_lines(lines, threshold):
"""
剔除斜率不一致的线段
:param lines: 线段集合, [np.array([[x_1, y_1, x_2, y_2]]),np.array([[x_1, y_1, x_2, y_2]]),...,np.array([[x_1, y_1, x_2, y_2]])]
"""
slopes = [calculate_slope(line) for line in lines]
while len(lines) > 0:
mean = np.mean(slopes)
diff = [abs(s - mean) for s in slopes]
idx = np.argmax(diff)
if diff[idx] > threshold:
slopes.pop(idx)
lines.pop(idx)
else:
break
return lines
left_lines = reject_abnormal_lines(left_lines, threshold=0.2)
right_lines = reject_abnormal_lines(right_lines, threshold=0.2)
def least_squares_fit(lines):
"""
将lines中的线段拟合成一条线段
:param lines: 线段集合, [np.array([[x_1, y_1, x_2, y_2]]),np.array([[x_1, y_1, x_2, y_2]]),...,np.array([[x_1, y_1, x_2, y_2]])]
:return: 线段上的两点,np.array([[xmin, ymin], [xmax, ymax]])
"""
# 1. 取出所有坐标点
x_coords = np.ravel([[line[0][0], line[0][2]] for line in lines])
y_coords = np.ravel([[line[0][1], line[0][3]] for line in lines])
# 2. 进行直线拟合.得到多项式系数
poly = np.polyfit(x_coords, y_coords, deg=1)
# 3. 根据多项式系数,计算两个直线上的点,用于唯一确定这条直线
point_min = (np.min(x_coords), np.polyval(poly, np.min(x_coords)))
point_max = (np.max(x_coords), np.polyval(poly, np.max(x_coords)))
return np.array([point_min, point_max], dtype=np.int32)
left_line = least_squares_fit(left_lines)
right_line = least_squares_fit(right_lines)
img = cv2.imread('img.jpg', cv2.IMREAD_COLOR)
cv2.line(img, tuple(left_line[0]), tuple(left_line[1]), color=(0, 255, 255), thickness=5)
cv2.line(img, tuple(right_line[0]), tuple(right_line[1]), color=(0, 255, 255), thickness=5)
cv2.imshow('lane', img)
cv2.waitKey(0)
```
##### **重难点讲解:least\_squares\_fit()函数讲解**
该函数主要做了三个部分:提取坐标点、进行直线拟合、计算直线上的两个点。
###### 1. 提取所有坐标点
```python
x_coords = np.ravel([[line[0][0], line[0][2]] for line in lines])
y_coords = np.ravel([[line[0][1], line[0][3]] for line in lines])
```
- **`lines`**:
- 输入的线段集合,每个线段是一个形状为 `(1, 4)` 的 NumPy 数组,表示线段的两个端点坐标 [*x*1,*y*1,*x*2,*y*2]。
- **`x_coords`**:
- 提取所有线段的 *x* 坐标。`line[0][0]` 是起点的 *x* 坐标,`line[0][2]` 是终点的 *x* 坐标。
- 使用列表推导式 `[[line[0][0], line[0][2]] for line in lines]` 生成一个二维列表,包含所有线段的起点和终点的 *x* 坐标。
- 使用 `np.ravel` 将二维列表展平为一维数组。
- **`y_coords`**:
- 提取所有线段的 *y* 坐标。`line[0][1]` 是起点的 *y* 坐标,`line[0][3]` 是终点的 *y* 坐标。
- 使用列表推导式 `[[line[0][1], line[0][3]] for line in lines]` 生成一个二维列表,包含所有线段的起点和终点的 *y* 坐标。
- 使用 `np.ravel` 将二维列表展平为一维数组。
###### 2. 进行直线拟合
```python
poly = np.polyfit(x_coords, y_coords, deg=1)
```
- **`np.polyfit`**:
- 这是 NumPy 中的一个函数,用于对给定的数据点进行多项式拟合。
- 参数:
- `x_coords`:自变量 *x* 的值。
- `y_coords`:因变量 *y* 的值。
- `deg=1`:指定拟合多项式的次数为 1,即**线性拟合**。
- 返回值:
- 返回拟合多项式的系数,从最高次项到常数项。对于线性拟合,返回两个值 `[slope, intercept]`,分别表示直线的斜率和截距。
###### 3. 计算直线上的两个点
```python
point_min = (np.min(x_coords), np.polyval(poly, np.min(x_coords)))
point_max = (np.max(x_coords), np.polyval(poly, np.max(x_coords)))
```
- **`np.min(x_coords)`** 和 **`np.max(x_coords)`**:
- 分别计算 *x* 坐标中的最小值和最大值。
- **`np.polyval(poly, x)`**:
- 这是 NumPy 中的一个函数,用于计算多项式在给定的 *x* 值处的 *y* 值。
- 参数:
- `poly`:拟合多项式的系数数组。
- `x`:输入的 *x* 值。
- 返回值:
- 返回多项式在 *x* 处的 *y* 值。
- **`point_min`** 和 **`point_max`**:
- `point_min` 是直线上的一个点,其 *x* 坐标为最小值,*y* 坐标通过多项式计算得到。
- `point_max` 是直线上的一个点,其 *x* 坐标为最大值,*y* 坐标通过多项式计算得到。
###### 4. 返回值
```python
return np.array([point_min, point_max], dtype=np.int32)
```
- 返回一个形状为 `(2, 2)` 的 NumPy 数组,表示直线上的两个点的坐标。这两个点可以唯一确定一条直线。
* * *
### 视频流读写
cv2.VideoCapture
capture.read
- 基础代码介绍:
```python
# @Author : LiZhongzheng
# 开发时间 :2025-04-29 17:06
import cv2
capture = cv2.VideoCapture('video.mp4')
# capture = cv2.VideoCapture(0) #读取当前设备第0个摄像头
while True:
ret, frame = capture.read() # ret 视频流的状态,frame 当前帧的图像
cv2.imshow('frame', frame)
cv2.waitKey(20) # 相当于播放速率
```
cv2.VideoWriter
最后我们不仅可以识别图片的车道线还可以识别视频的车道线,原理相同,因为视频是一帧一帧的,每一帧就是一个图片。
```python
# @Author : LiZhongzheng
# 开发时间 :2025-04-29 17:12
import cv2
import numpy as np
def get_edge_img(color_img, gaussian_ksize=5, gaussian_sigmax=1, canny_threshold1=50, canny_threshold2=100):
"""
灰度化,模糊,canny变换,提取边缘
:param color_img: 彩色图,channels=3
"""
"""
cv2.GaussianBlur() 函数参数
color_img:
输入的彩色图像,必须是 3 通道的 BGR 图像。
gaussian_ksize(可选):
高斯模糊的核大小。必须是正奇数,默认值为 5。
gaussian_sigmax(可选):
高斯模糊的 X 方向标准差,默认值为 1。
"""
gaussian = cv2.GaussianBlur(color_img, (gaussian_ksize, gaussian_ksize),
gaussian_sigmax) # 使用 cv2.GaussianBlur 对输入图像进行高斯模糊处理。高斯模糊可以减少图像中的噪声,使边缘检测更加稳定。
gray_img = cv2.cvtColor(gaussian, cv2.COLOR_BGR2GRAY)
edges_img = cv2.Canny(gray_img, canny_threshold1, canny_threshold2)
return edges_img
def roi_mask(gray_img):
"""
对gray_img进行掩膜
:param gray_img: 灰度图,channels=1
"""
poly_pts = np.array([[[0, 368], [300, 210], [340, 210], [640, 368]]])
mask = np.zeros_like(gray_img)
mask = cv2.fillPoly(mask, pts=poly_pts, color=255)
img_mask = cv2.bitwise_and(gray_img, mask)
return img_mask
def get_lines(edge_img):
"""
获取edge_img中的所有线段
:param edge_img: 标记边缘的灰度图
"""
def calculate_slope(line):
"""
计算线段line的斜率
:param line: np.array([[x_1, y_1, x_2, y_2]])
:return:
"""
x_1, y_1, x_2, y_2 = line[0]
return (y_2 - y_1) / (x_2 - x_1)
def reject_abnormal_lines(lines, threshold=0.2):
"""
剔除斜率不一致的线段
:param lines: 线段集合, [np.array([[x_1, y_1, x_2, y_2]]),np.array([[x_1, y_1, x_2, y_2]]),...,np.array([[x_1, y_1, x_2, y_2]])]
"""
slopes = [calculate_slope(line) for line in lines]
while len(lines) > 0:
mean = np.mean(slopes)
diff = [abs(s - mean) for s in slopes]
idx = np.argmax(diff)
if (diff[idx] > threshold):
slopes.pop(idx)
diff.pop(idx)
else:
break
return lines
def least_squares_fit(lines):
"""
将lines中的线段拟合成一条线段
:param lines: 线段集合, [np.array([[x_1, y_1, x_2, y_2]]),np.array([[x_1, y_1, x_2, y_2]]),...,np.array([[x_1, y_1, x_2, y_2]])]
:return: 线段上的两点,np.array([[xmin, ymin], [xmax, ymax]])
"""
"""
np.polyfit 是 NumPy 库中的一个函数,用于对给定的数据点进行多项式拟合。
它通过最小二乘法找到一个多项式,使得这个多项式在给定数据点上的值与实际值之间的误差平方和最小。
"""
x_coords = np.ravel([[line[0][0], line[0][2]] for line in lines])
y_coords = np.ravel([[line[0][1], line[0][3]] for line in lines])
poly = np.polyfit(x_coords, y_coords, deg=1)
point_min = (np.min(x_coords), np.polyval(poly, np.min(
x_coords))) # 这行代码的作用是计算拟合直线(或多项式曲线)上的一个特定点的坐标。具体来说,它计算的是当 x 取最小值时,对应的 y 值,并将这个点的坐标存储为一个元组 (x_min, y_min)。
point_max = (np.max(x_coords), np.polyval(poly, np.max(x_coords)))
return np.array([point_min, point_max], dtype=np.int32)
# 获取所有线段
lines = cv2.HoughLinesP(edge_img, 1, np.pi / 180, 15, minLineLength=40,
maxLineGap=20)
# 按照斜率分成车道线
left_lines = [line for line in lines if calculate_slope(line) > 0]
right_lines = [line for line in lines if calculate_slope(line) < 0]
# 剔除离群线段
left_lines = reject_abnormal_lines(left_lines)
right_lines = reject_abnormal_lines(right_lines)
return least_squares_fit(left_lines), least_squares_fit(right_lines)
def draw_lines(img, lines):
"""
在img上绘制lines
:param img:
:param lines: 两条线段: [np.array([[xmin1, ymin1], [xmax1, ymax1]]), np.array([[xmin2, ymin2], [xmax2, ymax2]])]
:return:
"""
left_line, right_line = lines
cv2.line(img, tuple(left_line[0]), tuple(left_line[1]), color=(0, 255, 255),
thickness=5)
cv2.line(img, tuple(right_line[0]), tuple(right_line[1]),
color=(0, 255, 255), thickness=5)
def show_lane(color_img): # 封装
"""
在color_img上画出车道线
:param color_img: 彩色图,channels=3
:return:
"""
edge_img = get_edge_img(color_img)
mask_gray_img = roi_mask(edge_img)
lines = get_lines(mask_gray_img)
draw_lines(color_img, lines)
return color_img
if __name__ == '__main__':
capture = cv2.VideoCapture('video.mp4')
while True:
ret, frame = capture.read()
frame = show_lane(frame)
cv2.imshow('frame', frame)
cv2.waitKey(10)
```
* * *
以上就是我对这个项目的总结。
项目上传到[github项目](https://github.com/lizhongzheng13/openCV_Lane_Detection/tree/main)
本文来自投稿,不代表本站立场,如若转载,请注明出处:http//www.knowhub.vip/share/2/3007
- 热门的技术博文分享
- 1 . ESP实现Web服务器
- 2 . 从零到一:打造高效的金仓社区 API 集成到 MCP 服务方案
- 3 . 使用C#构建一个同时问多个LLM并总结的小工具
- 4 . .NET 原生驾驭 AI 新基建实战系列Milvus ── 大规模 AI 应用的向量数据库首选
- 5 . 在Avalonia/C#中使用依赖注入过程记录
- 6 . [设计模式/Java] 设计模式之工厂方法模式
- 7 . 5. RabbitMQ 消息队列中 Exchanges(交换机) 的详细说明
- 8 . SQL 中的各种连接 JOIN 的区别总结!
- 9 . JavaScript 中防抖和节流的多种实现方式及应用场景
- 10 . SaltStack 远程命令执行中文乱码问题
- 11 . 推荐10个 DeepSeek 神级提示词,建议搜藏起来使用
- 12 . C#基础:枚举、数组、类型、函数等解析
- 13 . VMware平台的Ubuntu部署完全分布式Hadoop环境
- 14 . C# 多项目打包时如何将项目引用转为包依赖
- 15 . Chrome 135 版本开发者工具(DevTools)更新内容
- 16 . 从零创建npm依赖,只需执行一条命令
- 17 . 关于 Newtonsoft.Json 和 System.Text.Json 混用导致的的序列化不识别的问题
- 18 . 大模型微调实战之训练数据集准备的艺术与科学
- 19 . Windows快速安装MongoDB之Mongo实战
- 20 . 探索 C# 14 新功能:实用特性为编程带来便利
- 相关联分享
- OpenCV 车道检测项目入门项目DEMO